Using the log explorer
The log explorer page allows you to search and filter logs so you can investigate issues and perform root-cause analysis.
Time period
- Use the Time period list at the top right of the page to select the range of logs to display.
- Navigate your data using the timeline: click and drag your mouse over the graph to select a new time range. Use the Stacking icon to the left of the chart to choose how log volume is displayed: as a total, or stacked by severity or service name.
Searching for logs
Filters panel
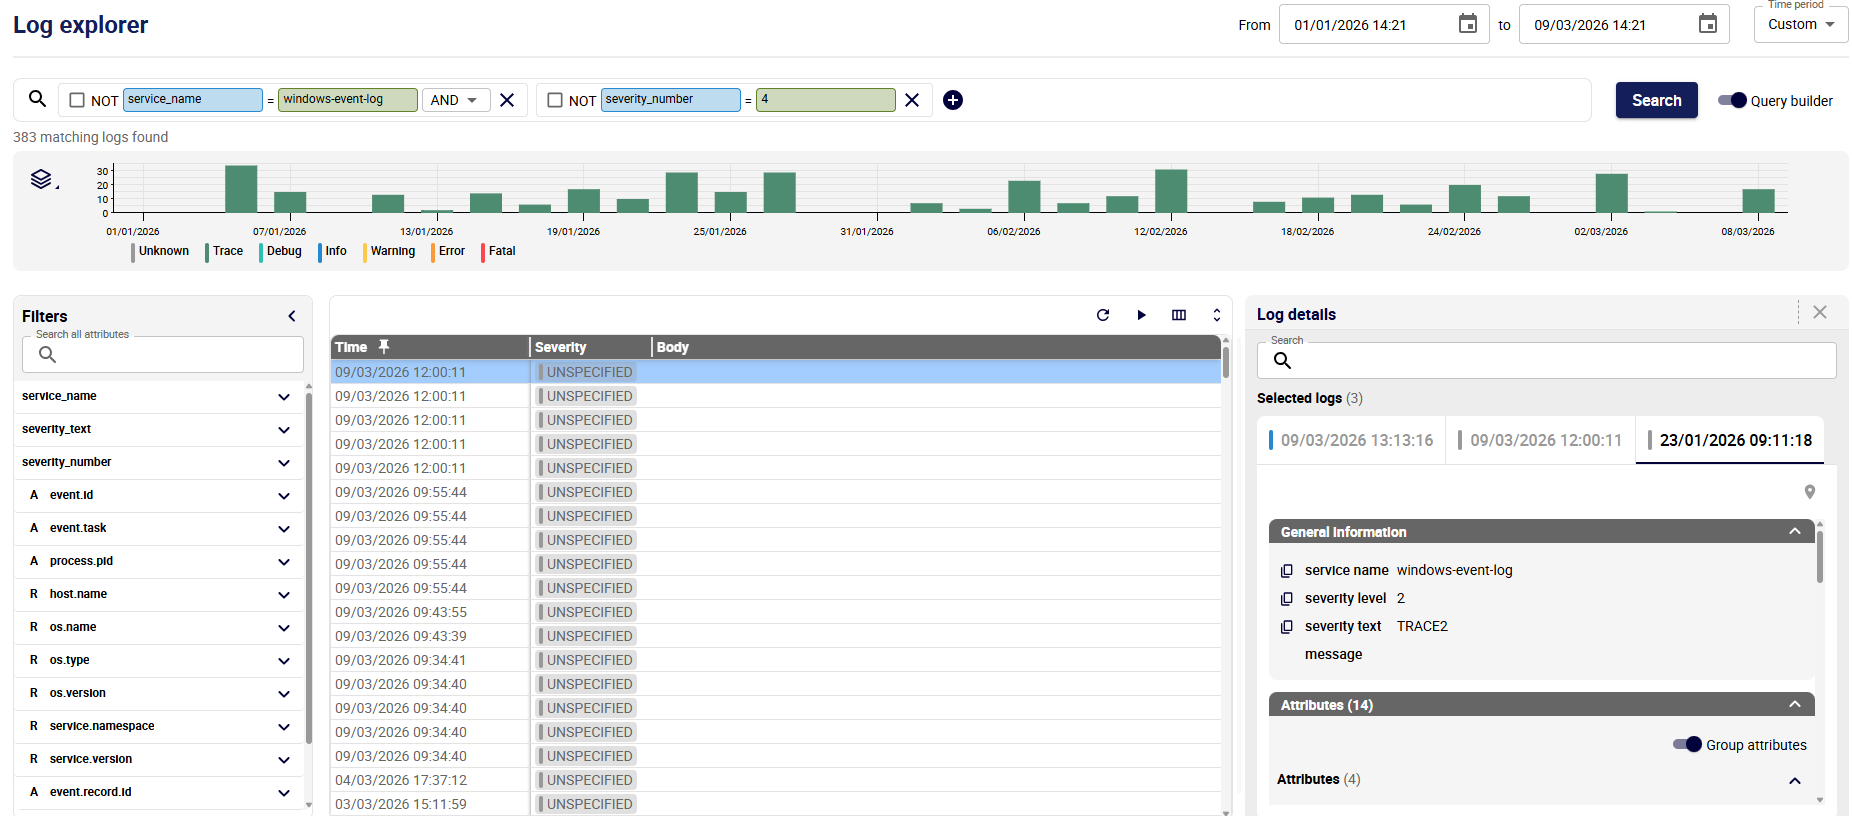
The Filters panel lists all OpenTelemetry attributes present in your logs for the selected time period. It works in conjunction with the search bar.
- Expand an attribute to view all its values and their number of occurrences. This gives you a quick overview of your data distribution without writing a single query.
- The Search all attributes field filters all attributes in real time. Once an attribute is expanded, Search values lets you search for a specific value among all available ones.
- Click the + at the left of a value to add it directly as a clause in the active Query Builder or Query Editor.
Search bar
Use the search bar to filter your logs. The search bar has two modes (use the switch on the right to select the one you want):
-
In Query builder mode, blocks let you build your search step by step - you add a block, then you select attribute names and values and select syntax elements like AND, OR, and NOT. Click the plus sign in the search bar to add a blank block.
-
In query editor mode:
-
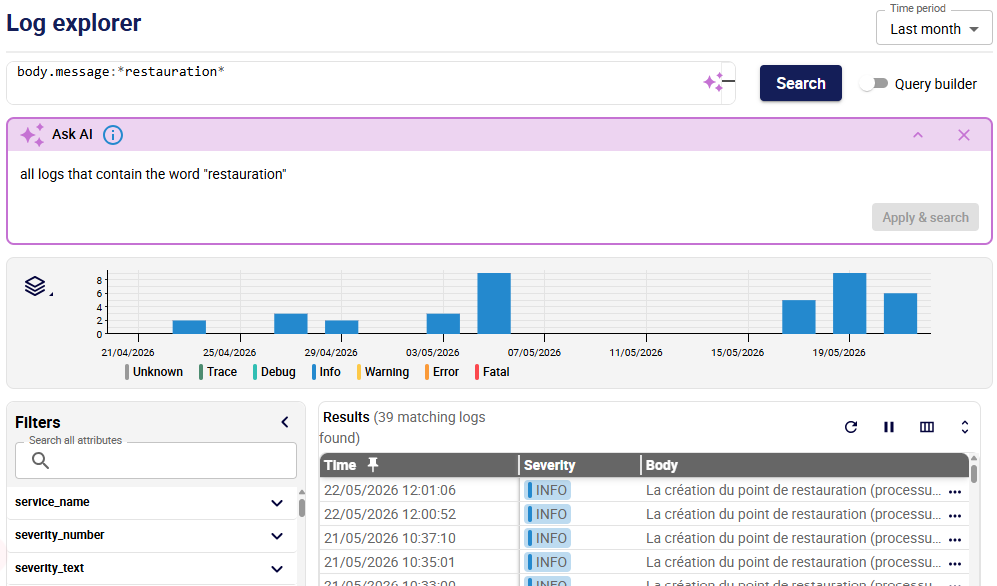
Type your search directly using the query syntax. Autocomplete and error detection help you write queries faster and avoid mistakes. Hover over a flagged mistake to see explanations and suggestions.
-
Click the Ask AI button to the right of the search bar. In the field that appears, write a query with your own words and in any language, then click Apply and search. This will generate a query with the correct syntax in the query editor: you can edit it to enrich the query if you like. This is a good way to learn the query syntax.
AI responses may be inaccurate or incomplete. Always check the results.
-
Running the search
In both modes, you need to click the Search button to run the search.
Detailed log info
Click a log to see all related information in the Log details panel, including the raw OpenTelemetry log entry.
- You can open several logs in the panel.
- Copy or download the whole log in json format from the Raw OTel log section.
- The search bar will inspect attribute names and values.
Rearranging columns
-
The default columns are Time, Severity and Body.
-
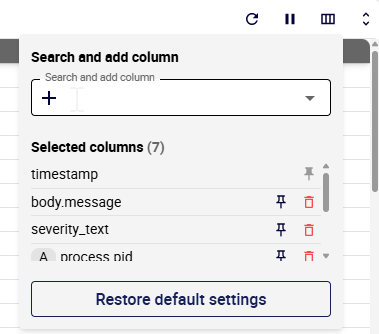
Use the Search and add column button at the top right of the results to choose which columns/attributes you want to display.
-
In this window, you can reset the display to the 3 default columns.
-
The Time column is always displayed first and cannot be unpinned. You can pin one other column in second position.
-
You can drag columns to a different position in the table.