Understanding RUM results
Once RUM is configured, click Real User Monitoring in the navigation bar at the top of the screen. Click the tabs under the navigation bar to view the data you want.
What RUM can tell you
Experience monitoring metrics and digital sobriety data are detailed in each tab, and presented as visuals, graphs or tables - aggregated according to different criteria.
-
An overview of the situation over the last 30 minutes is shown in the LIVE section. Typical use case: A colleague or customer service reports that the site is slow. Go to the Live view to immediately check if the data differs from normal.
Warning: Only the Live section displays the last 30 minutes. All other data on the page is set to the time period defined in the filter (blue box in the top-right corner).
-
Most visited pages:
- In the Summary & Live tab, a treemap shows a graphical view of your most visited pages. Clicking a URL in the treemap displays detailed data for this URL (under the table), in the URLs tab.
- For a detailed table of all URLs, use the URLs tab.
- On the URLs tab, check the box on the left to display charts for a specific URL or to compare data for several URLs (click the Compare button below the table).
-
Geographic data:
- In the Summary & Live tab, you can see a map of where your users are located. Click a country to see detailed data for that country.
- Check the Countries and Cities tabs to see more detailed aggregated data.
-
Digital sobriety data: aggregated eco-design scores and CO2 emissions are included in all tabs.
-
System data: view information about your users' browsers and operating systems in the Browser and OS tabs. The Global view tab shows a donut chart of total browser usage.
Filtering RUM data
By default, RUM data is presented as averages. You can use percentiles to focus on specific segments of the data.
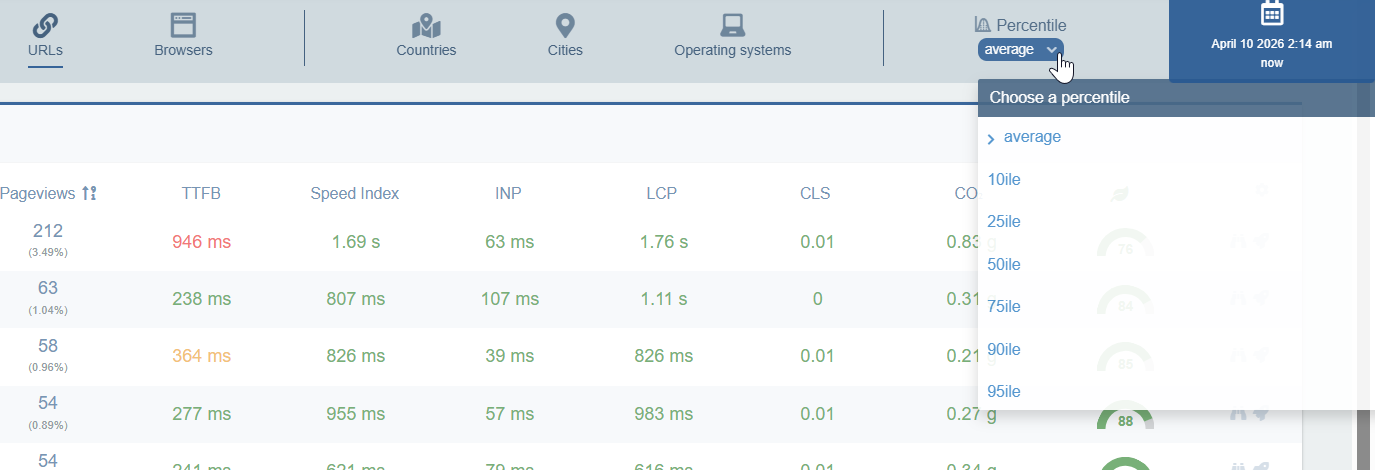
Percentiles from 10ile to 95ile show the distribution from "fast/low" to "slow/high" values:
- 10ile = only display best-case experiences
- 50ile = display typical user experience (median)
- 95ile = only display slowest experiences.
The 75th percentile is the most important. It is the percentile that Google uses to evaluate website speed in its own global Real User Monitoring program. Google's entire evaluation of a website's performance is based on the 75th percentile.