Digital Sobriety Score calculations
Digital Sobriety Score
Every website has an environmental cost. Servers consume energy, networks transfer data, and devices process it. All of it adds up. The Digital Sobriety Score (DSS) is Centreon's way of measuring that impact and turning it into a single, actionable grade.
You can find the DSS on the Global View.
The DSS displayed is calculated according to either RUM data or your user journey data. To change the used data, go to Configuration > Global view.
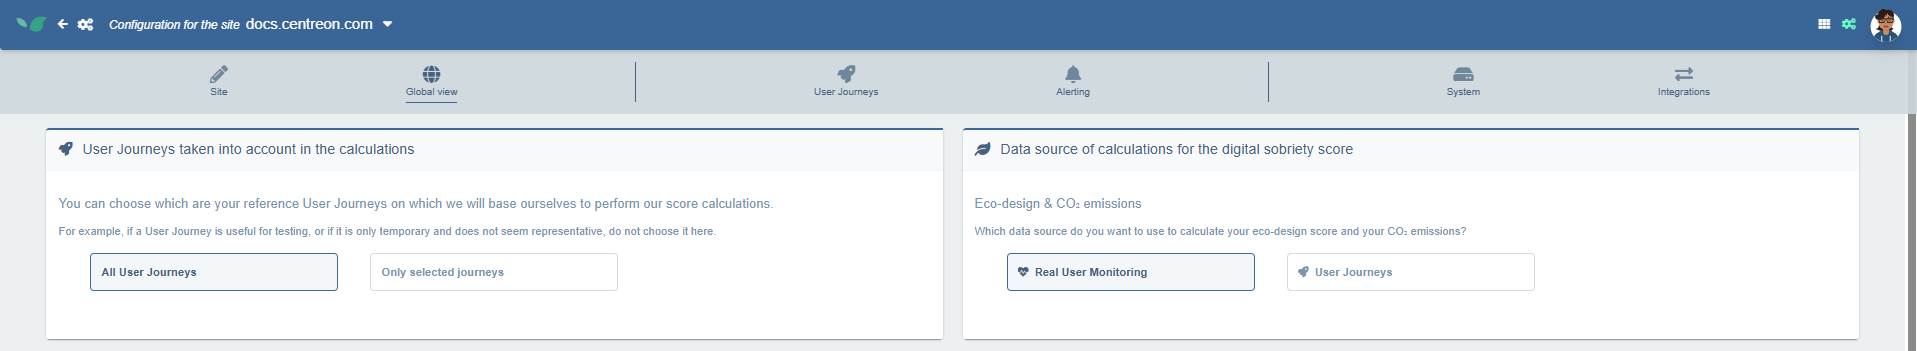
Here you can decide if you want to use RUM data or User Journeys data. Additionally, if you choose User Journeys, you can decide whether the score should be calculated using the data of all user journeys or only specific ones.
Note that it may take some time to calculate a new score after you change which data is used.
How is it calculated?
The Digital Sobriety Score combines several criteria into a single metric. It is not a measure of carbon emissions alone, but a comparative indicator designed to evaluate web applications independently of their audience size.
The site’s carbon footprint is calculated from measured traffic data and can be incorporated into a company’s overall carbon inventory to better represent digital emissions.
To allow comparison across web applications of different sizes, results are expressed relative to traffic.
The DSS combines two metrics:
- Carbon Footprint Per Click (CFPC) — the CO₂ emitted per page view or user interaction.
- Eco-Design Score (EDS) — a technical assessment of how efficiently the site is built and served.
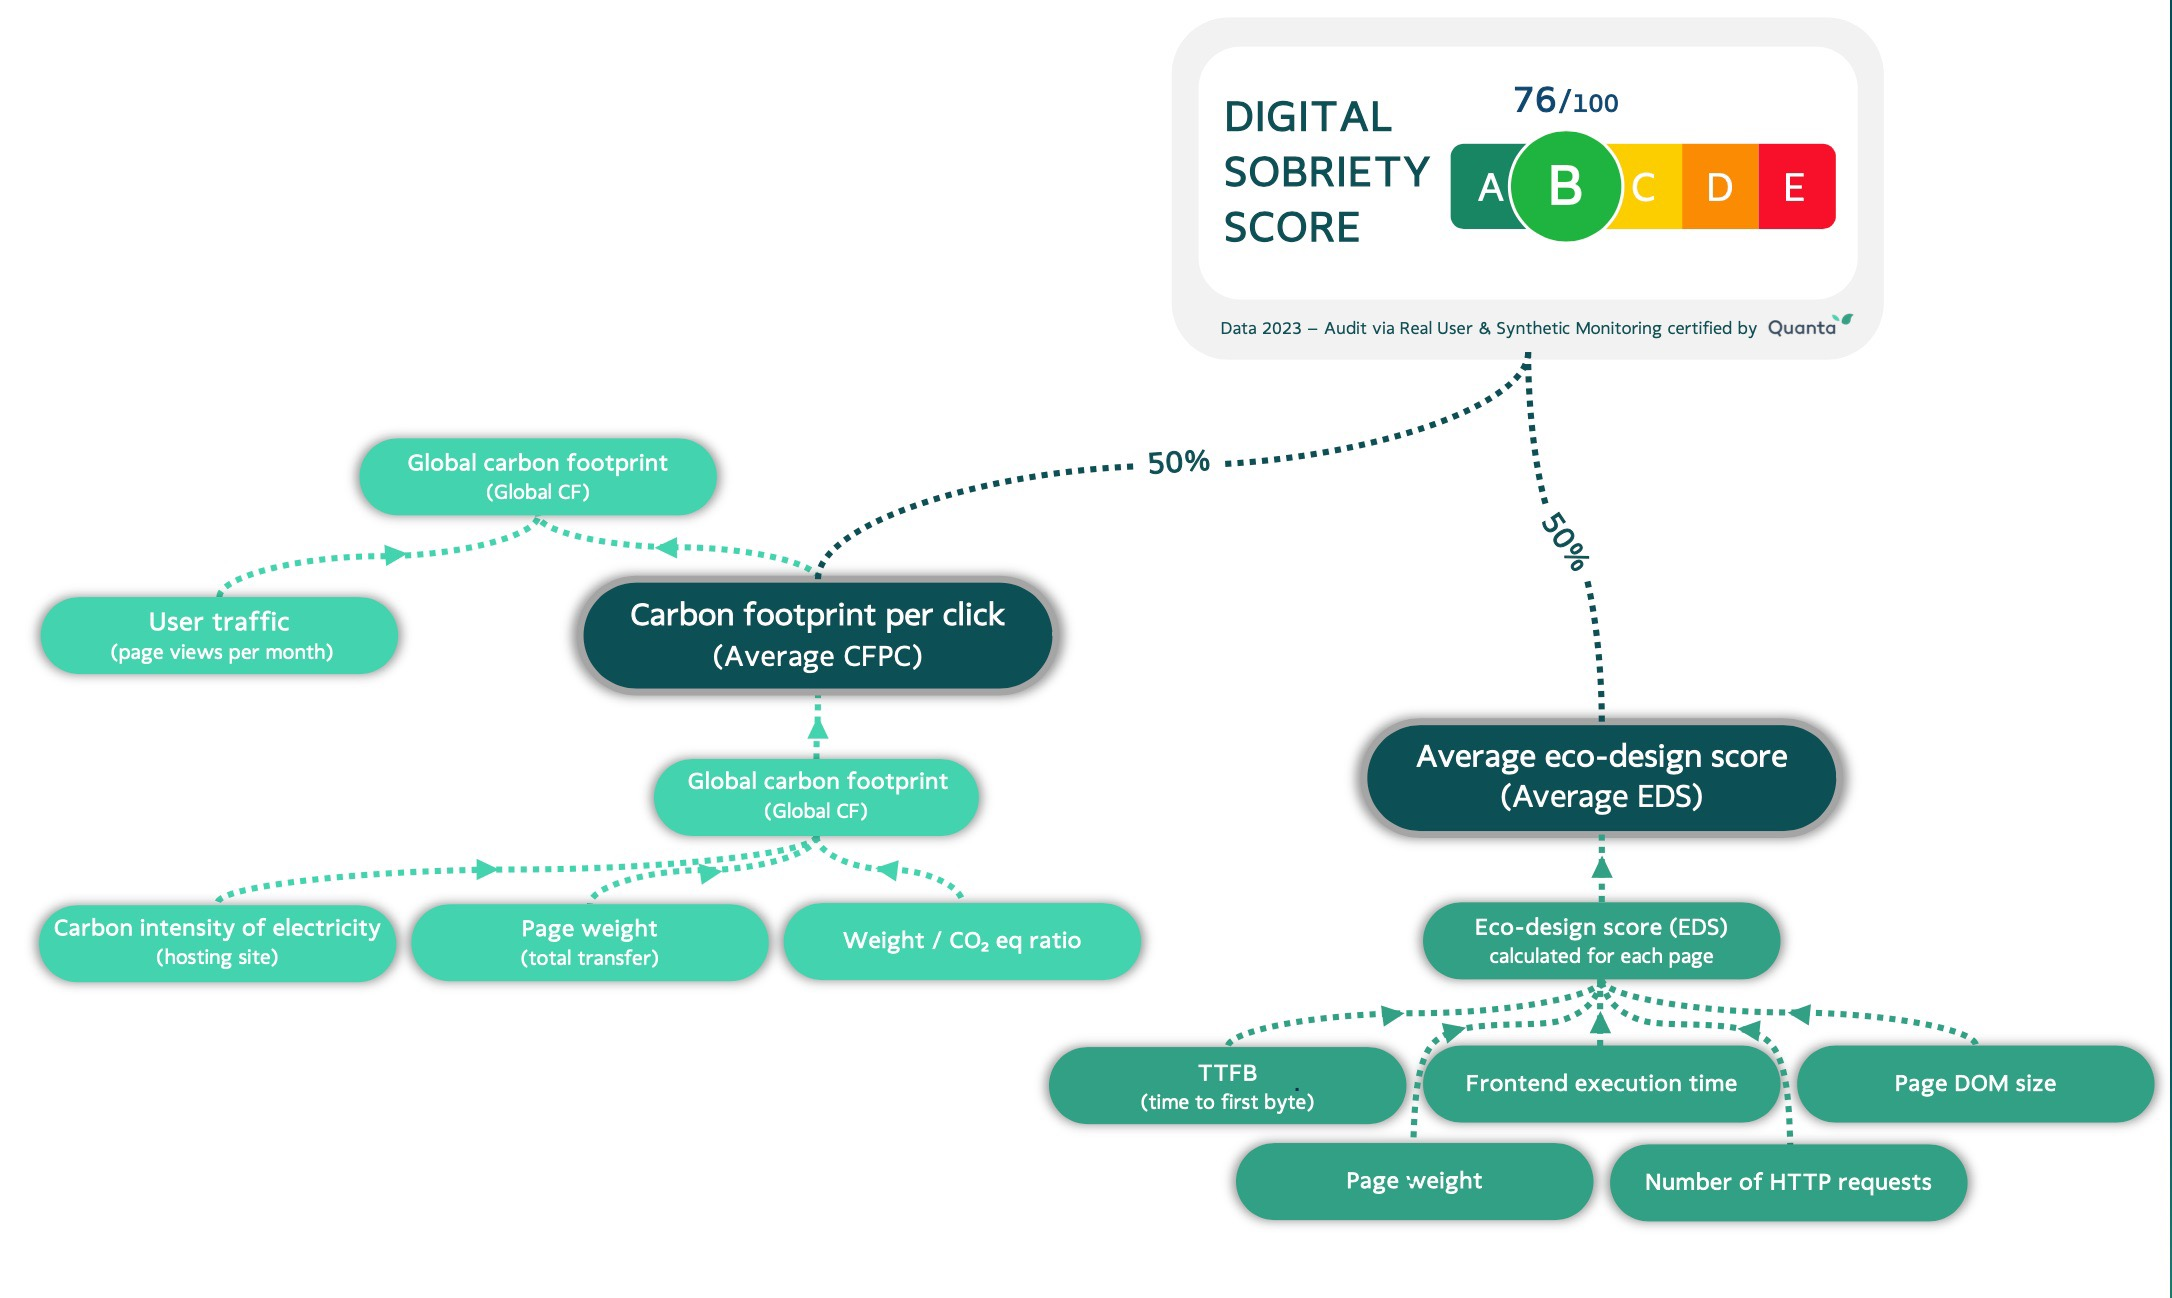
Together, they produce a score from 0 to 100, mapped to a letter grade:
| Score | Grade |
|---|---|
| 90–100 | A |
| 75–90 | B |
| 60–75 | C |
| 45–60 | D |
| 0–45 | E |
Results are expressed relative to traffic, so sites of different sizes can be fairly compared.
The DSS is somewhat similar to the GreenIT collective's Eco Index. The Eco Index emphasizes simple evaluation based on three technical criteria for a given URL, which is particularly useful during development. Experience Monitoring's DSS, on the other hand adopts a broader, audit-style approach more suited to sites already in production.
Before you start
To calculate your DSS, Experience Monitoring needs two things:
- Where are your servers located?
- Are they hosted in the cloud?
Go to Configuration > Site to fill in these details.
The DSS is calculated data from either your user journeys or RUM. To determine which one should be used go to the configuration page. In the Global view tab, you can select whether to use RUM or user journeys for the calculations.
Simple audit vs. full audit
There are two ways to get a DSS:
| Simple audit | Full audit | |
|---|---|---|
| Time to complete | 3–5 minutes | Minimum 7 days |
| Coverage | Average of the 10 most visited pages | 100% of pages, weighted by traffic |
| Setup required | None | RUM tag (GDPR-compatible) or User Journey |
| Cost | Free at quanta.green | Requires an Experience Monitoring license |
| Historical data | Quarterly, stored for 3 months | Real-time, stored for multiple years |
| Certificate | Yes | Yes |
The simple audit is a good starting point. The full audit is what you want for production sites — it gives a complete, continuously updated picture.
Getting a certificate
Centreon can issue a DSS certificate with detailed measurements suitable for presentations, communications, or displaying on your site.
Requirements:
- An Experience Monitoring Digital Sobriety license with Real User Monitoring enabled.
- An expert review to produce the full report.
Validity:
- First year: based on the previous 30 days of data.
- Renewal: based on the following 12 months.
- From year two onward: based on a full year of traffic, with optional year-over-year comparison.
What goes into the Eco-Design Score
For those who want the detail, the EDS is calculated from five technical indicators:
- Time To First Byte (TTFB) — how long the server takes to respond. Slower responses mean more energy used server-side.
- Page weight — the total data transferred per page load. Heavier pages consume more network and device resources.
- Frontend execution time — the time a user's device spends running JavaScript and rendering the page. Often overlooked, but it contributes to end-user device emissions.
- Number of HTTP(S) requests — each request adds network overhead and CPU load on both ends. Fewer is better.
- DOM size — the number of HTML elements in memory. Larger DOMs mean more work for the browser to render and update the page.