CLM basics
What are logs?
CLM handles logs. Logs contain detailed information about events, errors, and the performance of your IT system.
What does a log entry look like in CLM?
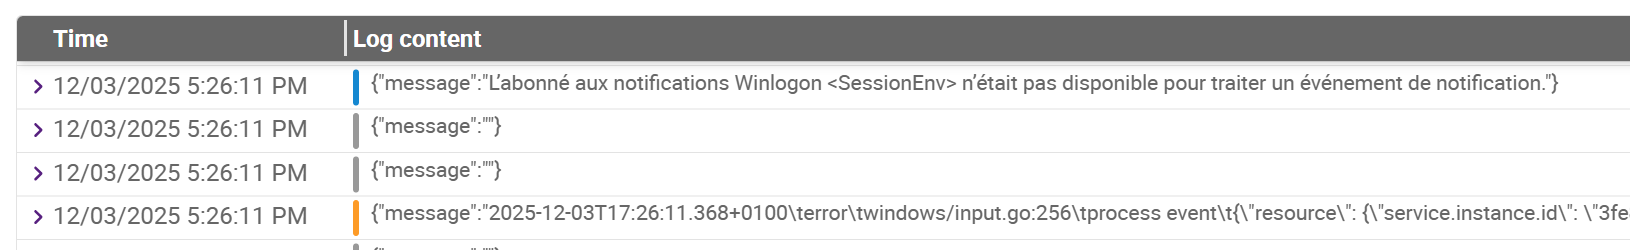
All logs received by CLM are listed on the Log Explorer page, where you can filter them. In CLM, each log entry has a severity (i.e., a log level), indicated by a colored line.
What can Centreon Log Management do with logs?
Here are the main features of Centreon Log Management:
-
CLM collects and centralizes logs from various sources (servers, applications, databases, network devices, etc.).
-
CLM allows you to analyze these logs in real time, using automatically generated summaries, filters, Lucene queries, or dashboards. This helps you detect detect anomalies, errors, security incidents, or unexpected behavior: see Use cases for detailed examples.
-
CLM sends notifications in the event of alerts, or critical thresholds being exceeded.
-
CLM allows you to store logs securely over long periods of time (for compliance, security, or historical analysis).
What is OpenTelemetry and how is it used by Centreon Log Management?
Logs are a type of telemetry data. Centreon Log Management can read logs in the OpenTelemetry format. OpenTelemetry is a protocol for sending this kind of data.
OpenTelemetry data is structured (often in JSON), standardized (with the same fields and format everywhere), and provides rich context about events, such as the service, environment, version, and custom attributes.
OpenTelemetry logs aren't just text: they're data you can analyze. And CLM lets you define dynamic alerts on them.
- You can send OpenTelemetry data directly to Centreon Log Management.
- If a device doesn't support OpenTelemetry, use an OpenTelemetry Collector to convert the data. The collector can run as an agent on the device or in gateway mode to receive, enrich, translate and forward logs to Centreon Log Management.
What does a log entry in OpenTelemetry format look like?
A log entry in OpenTelemetry format always has a timestamp and a service name (for the service that created the log). Usually, it also shows the log's severity: DEBUG, INFO, WARN, ERROR, or FATAL. All the other information in the log depends on how you have configured your OpenTelemetry Collector.
Here is an example of a raw log entry in OpenTelemetry format sent by the Windows Event Viewer:
{
  "attributes": {
    "event.id": 16394,
    "event.record.id": 226535,
    "event.task": "0",
    "process.pid": 0
  },
  "body": {
    "message": "La migration de bas niveau hors connexion a réussi."
  },
  "observed_timestamp_nanos": 1763648218788360200,
  "resource_attributes": {
    "event.provider.guid": "{A23B33B0-C8C9-472C-A5F9-F2BDFEA0X309}",
    "event.provider.name": "Microsoft-Windows-Security-SPP",
    "host.name": "MyLaptop",
    "os.name": "Microsoft Windows 10 Pro",
    "os.type": "windows",
    "os.version": "22H2",
    "service.namespace": "application",
    "service.version": "1.0.0"
  },
  "service_name": "windows-event-log",
  "severity_number": 9,
  "severity_text": "INFO",
  "timestamp_nanos": 1763648218609230600,
  "trace_flags": 0
}
-
Log attributes describe what the log is about (message details, error code, etc.)
-
Resource attributes show the context of the log, i.e. what produced this log. Here are some examples of common resource attributes for logs:
- service.name – the name of the service emitting the log
- service.version – version of the service
- host.name – hostname or machine name
- cloud.region – cloud region (e.g., us-east-1)
- k8s.container.name – Kubernetes container name
- deployment.environment – environment like prod or staging
In CLM, you can filter your data by using these attributes in Lucene queries.